
CI U.S. Stock Selection Corporate Class
Series F CADFund overview
This fund invests primarily in equity and equity-related securities of companies in the United States.
Fund details
| Inception date | December 2001 |
|
CAD
Total net assets ($CAD)
As at 2026-07-31
|
$265.3 million |
|
NAVPS
As at 2026-08-24 |
$41.2517 |
|
MER (%)
As at 2026-03-31 |
1.34 |
| Management fee (%) | 1.00 |
| Asset class | U.S. Equity |
| Currency | CAD |
| Minimum investment | $500 initial/$25 additional |
| Distribution frequency | Quarterly |
| Last distribution | $0.3352 |
Risk rating1
- Low
- Low to medium
- Medium
- Medium to high
- High
Performance2 As at 2026-07-31
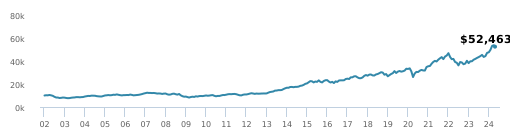
Growth of $10,000 (Since inception date)
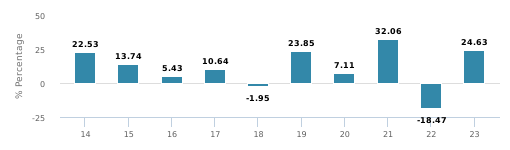
Calendar year performance
average annual compound returns
| YTD | 1 Mo | 3 Mo | 6 Mo | 1 Y | 3 Y | 5 Y | 10 Y | Inception* |
|---|---|---|---|---|---|---|---|---|
| 9.37% | 0.95% | 12.51% | 10.94% | 16.79% | 17.39% | 11.07% | 12.00% | 8.32% |
Distribution history3
| Payable date | Total |
|---|---|
| 2026-06-26 | 0.3352 |
| 2026-03-27 | 0.6556 |
| 2025-03-28 | 0.8233 |
| 2022-12-16 | 0.8809 |
| 2022-09-23 | 0.8897 |
| Payable date | Total |
|---|---|
| 2022-06-24 | 0.8411 |
| 2022-03-25 | 1.4363 |
| 2021-03-26 | 0.5026 |
| 2020-12-18 | 0.3019 |
| 2020-09-25 | 0.2926 |
CI PREFERRED PRICING4
| Investment amount | Combined fee reduction |
|---|---|
| $100,000 - $500,000 | 0.08% |
| $500,000 - $1,000,000 | 0.11% |
| $1,000,000 - $2,500,000 | 0.21% |
| $2,500,000 - $5,000,000 | 0.29% |
| $5,000,000 and above | 0.41% |
Management team
|
Jeremy Rosa
Aubrey Hearn
|
Note: This page is not complete without disclaimers on the next page.
CI U.S. Stock Selection Corporate Class
Series F CAD- US Equity 89.12
- International Equity 6.65
- Cash and Equivalents 4.22
- Other 0.01
- Technology 52.75
- Healthcare 25.96
- Consumer Services 9.21
- Financial Services 7.85
- Cash and Cash Equivalent 4.22
- Other 0.01
- United States 89.09
- Canada 4.25
- Netherlands 2.01
- Taiwan 1.96
- United Kingdom 1.54
- Cayman Islands 1.14
- Other 0.01
|
Top holdings7
|
Sector | (%) |
|---|---|---|
| 1. NVIDIA Corp | Computer Electronics | 10.13% |
| 2. Amazon.com Inc | Retail | 6.55% |
| 3. Alphabet Inc Cl C | Information Technology | 5.99% |
| 4. Microsoft Corp | Information Technology | 5.70% |
| 5. DexCom Inc | Healthcare Equipment | 5.49% |
| 6. Broadcom Inc | Computer Electronics | 4.99% |
| 7. Meta Platforms Inc Cl A | Information Technology | 4.38% |
| 8. CASH | Cash and Cash Equivalent | 4.22% |
| 9. Thermo Fisher Scientific Inc | Healthcare Equipment | 3.57% |
| 10. Mastercard Inc Cl A | Diversified Financial Services | 3.24% |
| 11. Apple Inc | Computer Electronics | 3.15% |
| 12. Bank of America Corp | Banking | 2.94% |
| 13. Advanced Micro Devices Inc | Computer Electronics | 2.67% |
| 14. Danaher Corp | Healthcare Equipment | 2.65% |
| 15. IQVIA Holdings Inc | Drugs | 2.36% |
Note: This page is not complete without disclaimers on the next page.
1 The risk level of a fund has been determined in accordance with a standardized risk classification methodology in National Instrument 81-102, that is based on the fund’s historical volatility as measured by the 10-year standard deviation of the fund’s returns. Where a fund has offered securities to the public for less than 10 years, the standardized methodology requires that the standard deviation of a reference mutual fund or index that reasonably approximates the fund’s standard deviation be used to determine the fund’s risk rating. Please note that historical performance may not be indicative of future returns and a fund’s historical volatility may not be indicative of future volatility.
2 Commissions, trailing commissions, management fees and expenses all may be associated with mutual fund investments. Please read the prospectus before investing. The indicated rates of return are the historical annual compounded total returns net of fees and expenses payable by the fund (except for figures of one year or less, which are simple total returns) including changes in security value and reinvestment of all dividends/distributions and do not take into account sales, redemption, distribution or optional charges or income taxes payable by any securityholder that would have reduced returns. Mutual funds are not guaranteed, their values change frequently, and past performance may not be repeated.
3 Please refer to the fund’s simplified prospectus for distribution information.
4 CI Preferred Pricing fee reductions apply to management and administration fees and start at $100,000.
7 The portfolio holdings are subject to change without notice and may only represent a small percentage of portfolio holdings. They are not recommendations to buy or sell any particular security.
The contents are not to be used or construed as investment advice or as an endorsement or recommendation of any entity of security discussed.
Certain statements contained in this communication are based in whole or in part on information provided by third parties and CI has taken reasonable steps to ensure their accuracy.
The rates of return are used only to illustrate the effects of the compound growth rate and are not intended to reflect future values or returns on investment in an investment fund.
The “Growth of $10,000 invested” chart shows the final value of a hypothetical $10,000 investment in securities in this class/series of the fund as at the end of the investment period indicated and is not intended to reflect future values or returns on investment in such securities.
Management Expense Ratio (“MER”) represents the trailing 12-month management expense ratio, which reflects the cost of running the fund, inclusive of applicable taxes including HST, GST and QST (excluding commissions and other portfolio transaction costs) as a percentage of daily average net asset value the period, including the fund’s proportionate share of any underlying fund(s) expenses, if applicable. The MER is reported in each fund’s Management Report of Fund Performance (“MRFP”). MRFPs can be found within the Documents tab on ci.com.
CI Global Asset Management is a registered business name of CI Investments Inc. ©CI Investments Inc. 2026. All rights reserved.
Published August 2026